Leuven Database of Ancient Books
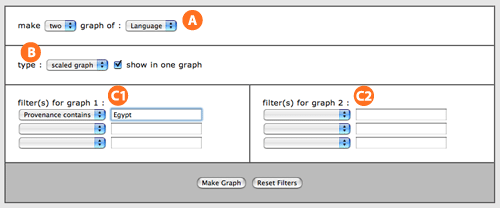
The LDAB can easily generate graphs that represent the data in a visually attractive way. The new graph options that are offered now, allow for more complex and specific queries to be presented in this way. [the letters A, B, C1-C2, D and E refer to the indications on the screenshots].
It is now possible to make a graph based on the features 'book form', 'culture', 'date', 'material' or 'language' [A]. The graph can be a pie graph, a bar graph or a scaled bar graph [B]. A scaled bar graph plots the results in percentages, whereas a normal bar graph shows the exact values. The graphs can be filtered by up to three different features at the same time [C1].
To compare queries, it is now possible to show two different graphs on the same page, optionally even in one graph (bar graphs only). One can e.g. compare the number of texts by language for papyri on the one hand, and parchment texts on the other, to see the differences. The two graphs will be displayed using the same feature [A], but can each have a set of up to three different parameters [C1 and C2].

Example
The following example illustrates the different possible options for the LDAB graphs:
We ask to make a graph by language (select 'one graph of language' in the field A); no filters applied (all fields in C1 or C2 are left blank); either select a pie graph or a bar graph from B, but not a scaled bar graph. The result shows the number of Greek, Latin, Demotic, Coptic and Hieratic papyri in the LDAB. A toggle link below the graph shows or hides the actual results table used in the graph, if you are interested in the exact values. Note that this graph includes both papyri and parchments from Egypt as well as the rest of the world. Papyrologists will usually limit the results to Egyptian texts only, hence we should set a filter for C1, e.g. 'provenance contains' = 'Egypt'. The resulting graph immediately shows a far lower number for Latin, since most Latin texts are parchments from monastic scribal centres in Western Europe, and not from Egypt.
To illustrate this difference, one could e.g. combine the graph of the first example with that of the second example in one single graph, and make it a scaled bar graph to illustrate the relative weight of non-Egyptian texts for the individual languages. To do so, set the properties for A to 'two graphs' of 'language', set B to 'scaled bar graph' and enable the option for 'show in one graph'. For graph 1, we should set one filter to 'provenance contains' = 'Egypt', which will show the percentage of texts in each language but only for texts coming from Egypt; for graph 2, no filters have to be set, since we want the percentage of texts for each language within to the whole database. The resulting graph [D; the blue bars are the first graph, showing only texts from Egypt, while the green bars represent all texts in the LDAB] shows that the percentage of Latin texts is heavily affected by the Latin parchments from Western Europe. The link below the graph shows or hides the results table [E].

Feel free to experiment with the features of the graphing tool of the LDAB; for any questions, remarks or suggestions, please contact willy.clarysse@arts.kuleuven.be.
